A special report from Analytic Index and The Mars Agency.
By all accounts and reporting parties, the critical Cyber 5 weekend turned out to be a big success for ecommerce retailers, with sales increasing 4% to $35.3 billion compared with 2021, according to Adobe Analytics.
That total, which broke historical records and let many retailers breathe a sigh of relief given concerns about the economy, included significant growth throughout the weekend: Sales rose 2.9% to $5.29 billion on Thanksgiving Day, 2.3% to $9.12 billion on Black Friday, and 5.8% to $11.3 billion on Cyber Monday, according to Adobe. The Cyber 5 window typically accounts for roughly 20% of all ecommerce sales in the holiday time frame (November and December).

When it comes to sales growth, however, a rising tide doesn’t necessarily raise all boats, and the specific winners among national brands varied significantly at Amazon and Walmart, the two largest ecommerce players in the U.S., according to an exclusive report prepared for The Mars Agency by Analytic Index.
The industry’s foremost platform for digital shelf intelligence, Analytic Index annually publishes recap reports tracking brand activity on Amazon.com and Walmart.com during the Cyber 5 period across all major product departments.
Through an exclusive partnership with The Mars Agency, Analytic Index has also compiled a report that presents a side-by-side comparison of activity in 11 key departments at the two ecommerce giants.
The report presents a clear picture of how much brand activity differs across the two retailers. In most departments, only a few of the weekend’s 10 top-selling brands (based on estimated share of sales) were the same at both Amazon and Walmart, and the brands involved in paid sponsorships and promotional executions often varied widely at each retailer.
While those facts obviously reflect a substantial difference in brand availability on each website (especially given Amazon’s larger inventory), they also suggest that many brands are taking different approaches to advertising at each retailer based on their marketplace position and business objectives.
“There is a lot of data to sift through in the report, but there is value in the specifics presented for each category,” says John Willkom, The Mars Agency’s SVP-Ecommerce. “It becomes pretty clear which brands have excess inventory, which have pricing power, and which ones are more focused on one retailer vs. the other.
“Overall this year, in most categories we saw smaller discounts percentage-wise, but on a larger number of items,” says Willkom. “For example, electronics accessories manufacturer Anker has 241 products on Amazon, and 219 of them had a Cyber Monday deal.”
Both Amazon and Walmart experienced a significant increase in “Department Visibility” during the period, which reflects either an increase in the total shopper volume or an increase in shopping activity across departments. Share of visibility for each department remained fairly consistent from year to year, however, with Home & Kitchen (called Home, Furniture & Appliances at Walmart) the most visible at on both sites, followed by Clothing and Electronics.
“Amazon continues to push hard into fashion, with efforts not only online but with a print ‘Amazon Fashion’ holiday catalog that was sent to homes across the country,” notes Willkom.
With some department-level exceptions at Walmart, both websites placed a stronger promotional emphasis on Cyber Monday than Black Friday this year — a strategy that appears to be reflected in the aforementioned industry-wide sales totals for those two days.
Among other general observations, Amazon placed a much heavier focus on its own brands such as Amazon Basics, although Walmart’s private labels dominated share of sales in the Grocery department.
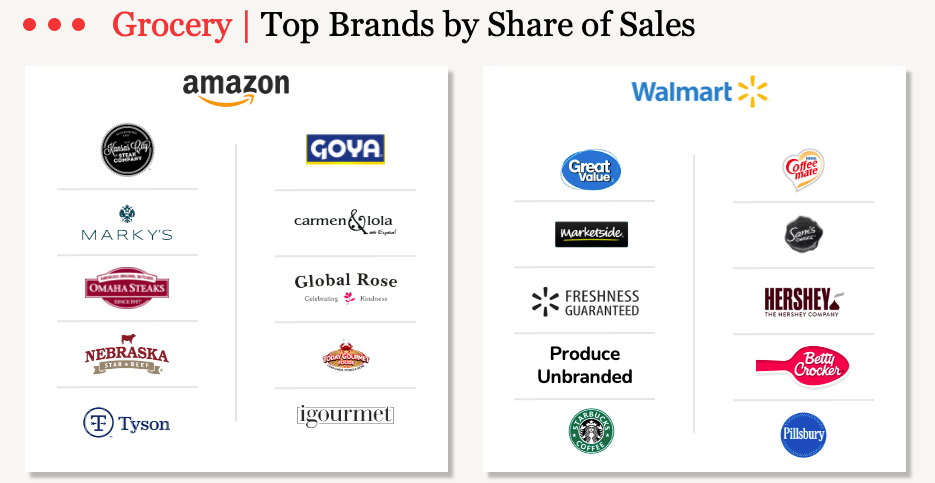
Grocery
Not a single brand ranked among the top 10 for share of sales at both Walmart and Amazon, although that fact may result from the possibility that Walmart shoppers were more likely than Amazon
visitors to be conducting typical grocery missions: pantry standards like own-brand Great Value, Starbucks and Betty Crocker ranked highly at Walmart, while “giftier” brands such as Kansas City Steak Company, Marky’s Caviar and Omaha Steaks topped the list at Amazon.
Similarly, Walmart seemed to take a more “business as usual” approach to the department, focusing nearly all (98%) of its promotional efforts on typical Rollback offers rather than specific Black Friday or Cyber Monday deals. On Amazon, roughly half of observed grocery deals where non-specific discounts, with about one-fourth labeled for one of the two event days.
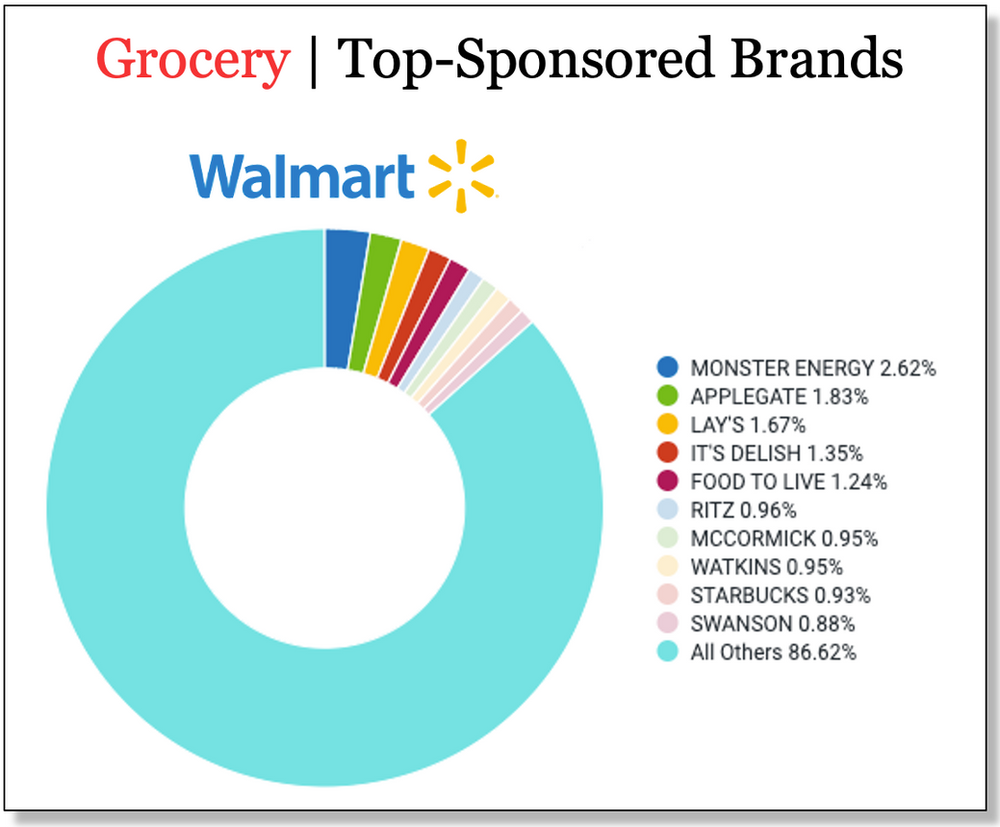
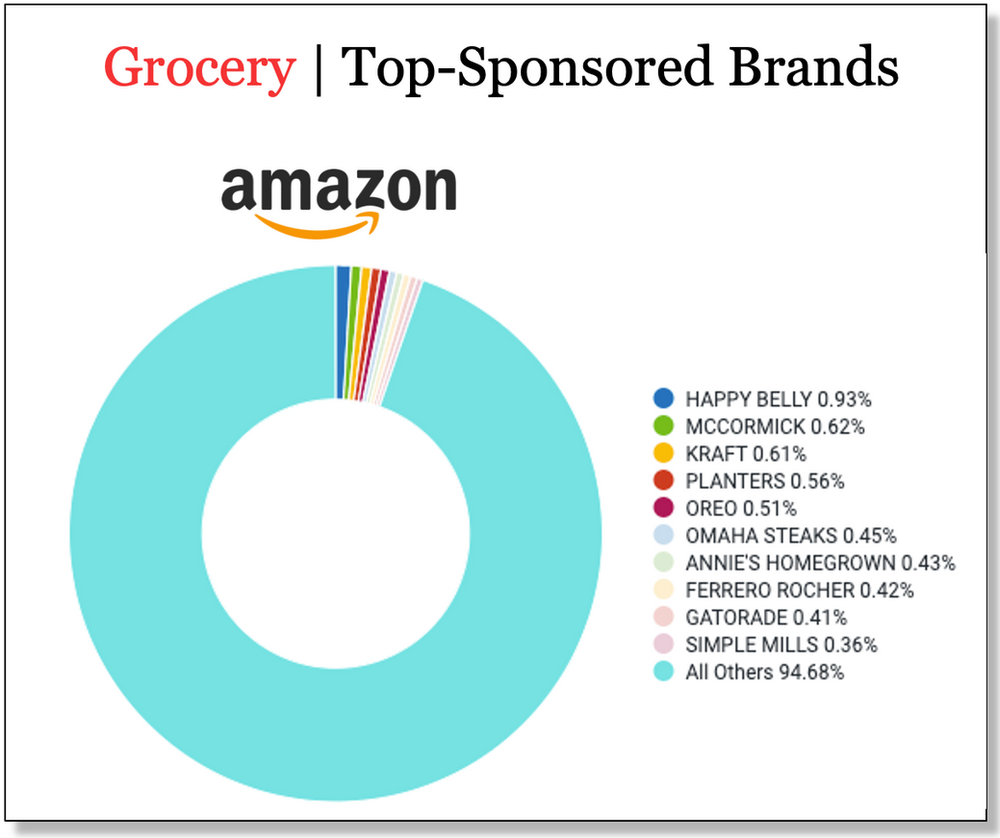
Meanwhile, McCormick was the only brand that ranked among the 10 most sponsored on both websites, although no brands dominated the activity to any great extent during the period.
In terms of visibility, however, the ubiquitous Great Value enjoyed an enviable 10% share at Walmart over the weekend, while Amazon’s own 365 by Whole Foods Market placed first there, although with a less than 2% share. Starbucks cracked the top 10 on both sites.
Sponsored Products accounted for 72% of observed sponsorship activity at Walmart, with various brand amplifiers accounting for the rest.
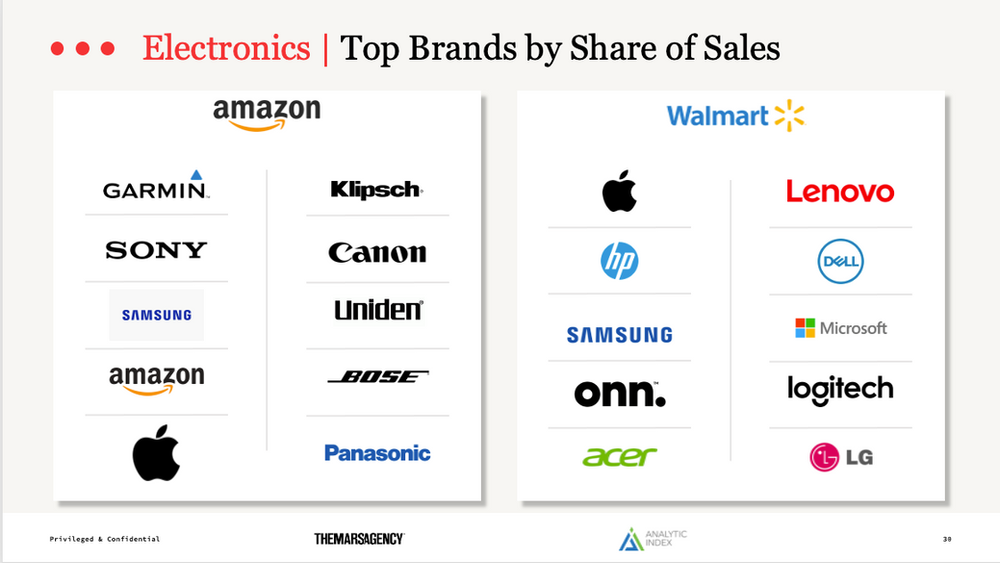
Electronics
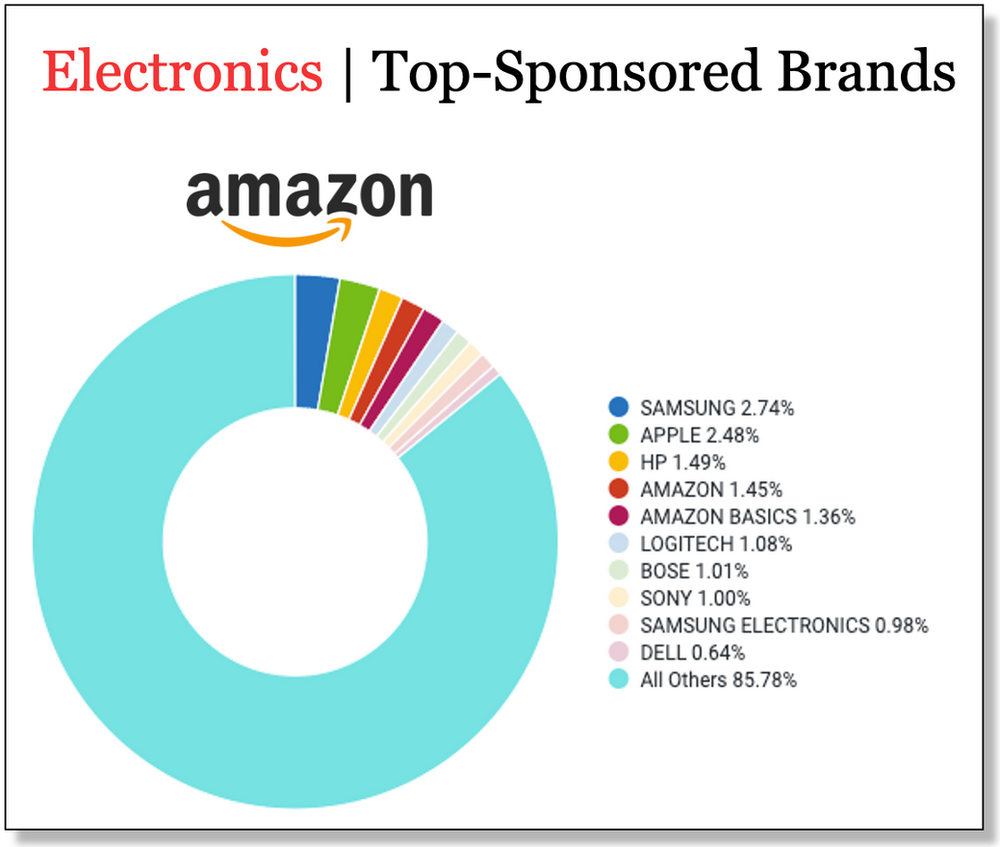
Here, two brands made the top 10 in sales at both retailers: Samsung and Apple. Apple ran promotions for a relatively equal number of products at both retailers, while Samsung placed a significantly heavier emphasis on discounts at Amazon.
At both retailers, Samsung and Apple finished 1-2 in sponsorship activity. In terms of visibility, Apple was first on both sites, with Samsung placing second at Walmart and third at Amazon behind the retailer’s own brand.
“Apple watches at Walmart only averaged between 5 and 10% off the retail price,” noted Willkom. “For brands like Apple with tremendous equity, simply participating in Cyber 5 has much greater value than offering a steep discount.”
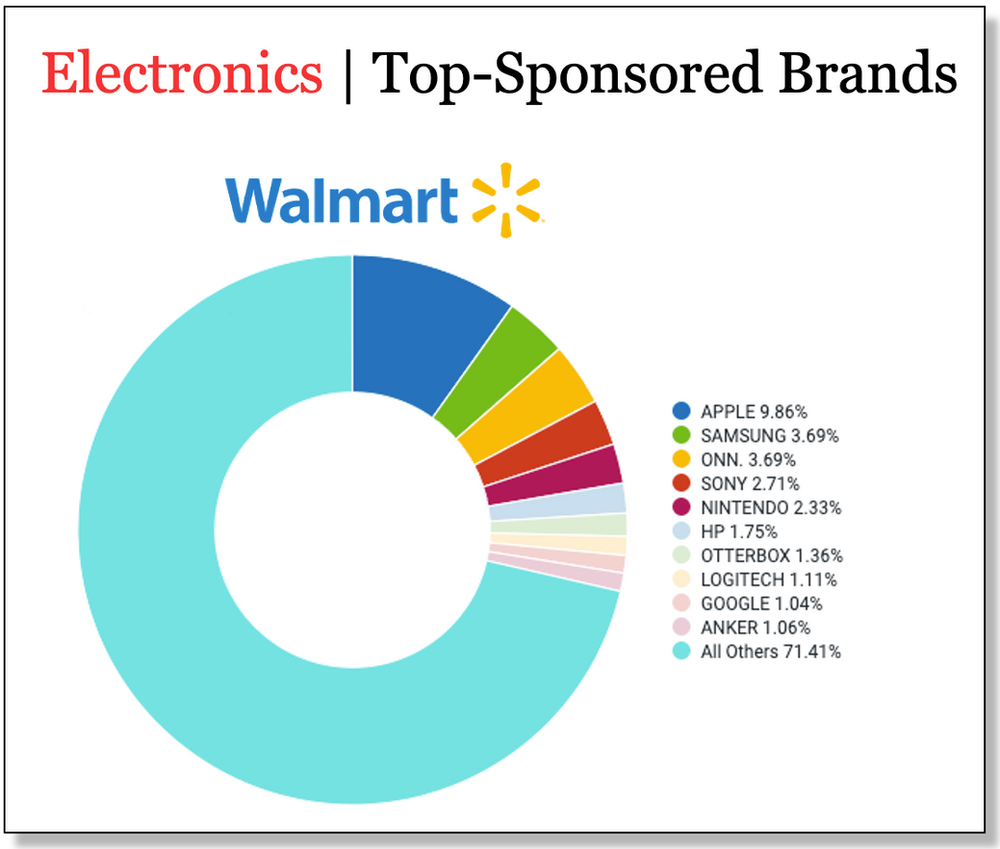
Walmart took a far more event-based approach in the Electronics department, with a large number of deals promoted specifically as Black Friday or Cyber Monday offers. Sponsored Products were far and away the ad vehicle of choice, accounting for just under 90% of observed activity.
On Amazon, Featured Products was the most prevalent ad vehicle for the Electronics department, accounting for 53% of observed activity. Sponsored Product ads represented 27%, followed by Brand Ads placed at the top of search results at 13%.
Adobe Analytics estimates that 30% of all Black Friday online sales were driven by paid search. Analytic Index finds that 60% of conversions are driven by the top 3 clicked items in Amazon search results, which makes Sponsored Products and other search-related ad opportunities a critical piece of the ecommerce marketing plan for any brand.
Download a copy of the full report here
ADDITIONAL Cyber 5 Resources AVAILABLE from Analytic Index
Cyber 5 Self-Service Reporting Tool
Learn how your brands (or those of your competitors) performed at either Amazon or Walmart over the Cyber 5 weekend by using this free, limited-time tool from Analytic Index. Similar to the exclusive report, this first-of-its-kind resource provides details on sales, promotions, sponsored search, and brand visibility at both the brand and category level.
The Ultimate Amazon Cyber 5 Recap
This comprehensive analysis covers all major Amazon departments. providing in-depth information on sales performance, retail media activity, promotional activity, and share of search.
The Ultimate Walmart Cyber 5 Recap
This comprehensive analysis covers all major Walmart departments, providing in-depth information on sales performance, retail media activity, promotional activity, and share of search.
To find out how to receive a custom ecommerce report from The Mars Agency, email us at [email protected].