Consumer spending on Black Friday rose 2.5% in 2023 compared to the prior year, with ecommerce sales rising 8.5% and in-store purchases increasing 1.1%, according to Mastercard’s SpendingPulse.
That’s a fairly impressive number considering that many U.S. consumers are still dealing with inflation and economic uncertainty, and since many retailers are no longer waiting for Black Friday to arrive before offering the extreme discounts that traditionally have run only during this massive annual sales event: Amazon unofficially kicked off its holiday activity with “Prime Big Deal Days” in early October; Walmart hosted “Black Friday Deals” as early as Nov. 8.
Those two retailing giants are always among the leading shopper destinations on Black Friday, and therefore critical places for consumer brands to stand out in front of the massive audiences that visit.
Tracking brand visibility on these two sites is a key mission for Analytic Index, one of the industry’s foremost platforms for digital shelf intelligence. Analytic Index annually publishes recap reports tracking brand activity on Amazon.com and Walmart.com during Black Friday and throughout the critical Cyber 5 sales window (Thanksgiving to Cyber Monday) across all major product departments.
Through its partnership with The Mars Agency, Analytic Index has compiled an exclusive special report examining visibility trends at Amazon.com and Walmart.com on Black Friday. The report takes a top-line look at impressions, sponsorship and promotional activity across all departments compared with 2022. It then takes a deep dive into trends in three key areas of the CPG marketplace: Grocery, Beauty, and Pet Supplies.
The report presents a clear picture of the departments and brands that gained the most visibility at Amazon and Walmart. But it also illustrates how much shopping behavior and brand activity differ across the two retailers. In fact, only a few of the day’s 10 top-selling brands (based on estimated share of sales) were the same at both Amazon and Walmart, and the brands involved in paid sponsorships and promotional executions varied widely at each retailer.
While those facts obviously reflect a substantial difference in brand availability on each website (especially given Amazon’s larger inventory), they also suggest that many brands are taking different approaches to advertising at each retailer based on their marketplace position and business objectives.
The following article presents highlights from the report, which can be downloaded in full above. Marketers can also learn how their own brands performed during over the Cyber 5 window by using Analytic Index’s free auditing tool.
Trends on Amazon.com
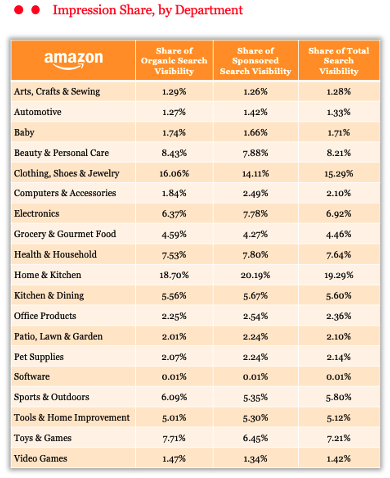
Amazon.com shoppers were apparently searching for deals of all types on Black Friday based on overall impressions, which were spread out across numerous departments. In fact, only two departments earned double-digit visibility shares: Home & Kitchen at 19.3%, and Clothing, Shoes & Jewelry at 15.3%.
In both departments, individual brands placed a significantly stronger emphasis on promotional opportunities (formal programs involving discounts identified in results by badges or other markers) than sponsored products (the more straightforward, paid “Sponsored” designations). That, in fact, was a general trend reflected across all Amazon departments this year: in 13 of the 19 departments included in the Analytic Index report, the percentage of items running sponsored programs declined compared with Black Friday 2022 while the percentage of promoted items increased in all but one department.
CALLOUT: Still, Analytic Index finds that the most successful brands utilize both tactics, securing sponsorships and event-specific promotions to gain “double exposure” for items they are promoting through sales and other offers.
Analytic Index also warns against brands assuming that their “always on” search strategies on retailer websites will cover their bases during Black Friday. Because shopping behavior can differ during these kinds of events, with searches often filtered for special sales and keyword terms adjusted to meet seasonal needs, brands should consider adjusting their strategies accordingly.
Elsewhere, the Electronics (6.9%) and Toys & Games (7.2%) departments received relatively low visibility totals, given their status as popular gift categories and, therefore, common Black Friday destinations. The percentage of items promoted increased significantly in both cases, while sponsored programs declined.
Although Beauty & Personal Care received the third-highest share of impressions (at 8.2%), CPG departments aren’t typically viewed as being top of mind for Black Friday shoppers. (Amazon’s classifications include beauty-related appliances in this department). Still, more brands in the Grocery & Gourmet Food and Pet Supplies departments took advantage of the Black Friday traffic to stage promotions this year than in 2022. In Beauty and Personal Care, the ranks of promoted items rose significantly (up 37.7%) while the number of sponsored products stayed roughly the same (down 0.8%).
Leading Brands on Amazon.com
A look at the top Black Friday brands (based on estimated share of sales) on Amazon.com across the Beauty, Grocery and Pet departments presents clear evidence that Amazon.com provides a level playing field for smaller companies:
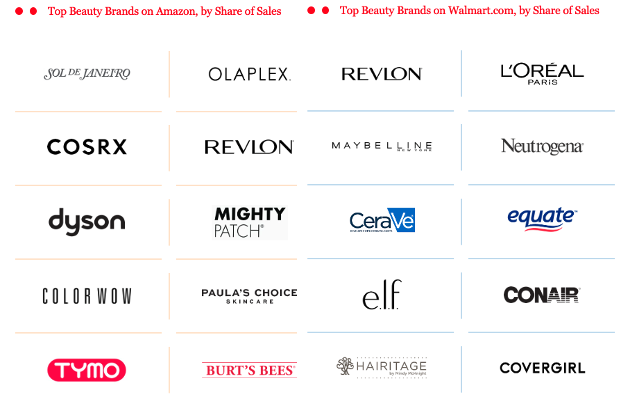
- In Beauty, Revlon and Burt’s Bees were the only longstanding national brands ranked in the top 10, which was dominated by newer, smaller players like Sol de Janeiro, CosRX, ColorWow and Paula’s Choice.
- Similarly, in Grocery, coffee giants Nespresso, Starbucks, and Keurig Dr Pepper’s Original Donut Shop and McCafé were joined by six alternative beverage brands, including Poppi, Solimo, and Core Power.
- Nestle Purina One, Pro Plan & Fancy Feast, along with Mars, Inc.’s Greenies, graced the top 10 in Pet Supplies, alongside lesser-known brands Blink (pet cameras), Bedsure (blankets and beds) and ChomCom (hair removal rollers).
Anyone looking for correlations between the top-selling and top-sponsored items, however, are out of luck: Not a single brand made both lists in any of the three departments. In fact, seven of the 10 most-sponsored Beauty & Personal Care items were oral-care products, while candy and snacks represented six of the most-sponsored Grocery products. Nestle Purina did have two of the most-sponsored Pet items, but for different brands than its top sellers.
Perhaps not surprisingly, there is more of a correlation between best sellers and brands showing up on Analytic Index’s list of Trending Items, the products whose Black Friday visibility increased the most between 2022 and 2023.
In Beauty, five products on the Trending list came from brands on the best sellers list, while Nespresso ASINs gained three spots among the trending items in Grocery. But even this correlation fizzles in Pet, where Purina had two trending items— but again, for different brands.
 Trends on Walmart.com
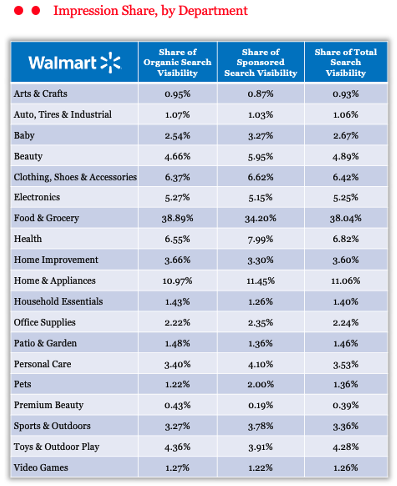
Compared with Amazon.com, traffic trends on Walmart.com make it fairly evident that there were plenty of “business as usual” Black Friday shoppers visiting the site in addition to the many holiday gift and deal seekers: the Food & Grocery department gained 38.04% of total impressions during the day. That’s more than three times greater than the next highest department on Walmart.com — Home & Appliances at 11.1% — and more than eight times higher than what Grocery earned on Amazon.com (4.5%).
Otherwise, visibility was distributed widely, with only three common gift-idea departments receiving more than 5%: Clothing, Shoes & Accessories at 6.4%, and Electronics and Beauty at roughly 5.3% each. (Note: Following Walmart’s classification system, Analytic Index data segments this department into Beauty and Premium Beauty.)
Interestingly, the trend in promoted vs. sponsored brands went in the exact opposite direction at Walmart: the percentage of promoted items declined in 15 of the 19 departments covered in the report, while the number of sponsored products increased across all 19.
It’s worth noting that both promotional and sponsored activity at the department level is far lower than it is on Amazon. While it’s common for more than 20% of the items in a department to be promoted or sponsored on Amazon.com, that’s never the case on Walmart.com. (The retailer’s EDLP pricing strategy certainly plays a factor here.)
Leading Brands on Walmart.com
The Walmart.com environment seems to be far more favorable to established national brands than Amazon.com is. Among the top-selling brands in the Beauty, Grocery and Pet departments:
- All but one in Beauty (Hairitage) are leading names such as Revlon, L’Oréal, Maybelline, Neutrogena and CoverGirl; Walmart’s own Equate made it onto the list as well.
- In Grocery, three of Walmart’s private labels make the cut (Great Value, Marketside and Freshness Guaranteed) alongside Hershey, five national coffee brands, and general produce. (Note: their shelf-stable, bulk-purchase characteristics make coffee products common top-sellers on the two sites, according to Analytic Index.)
- Almost the entire Pet list comprises brands from Mars, Inc., Nestle Purina and Walmart itself — with Kaytee bird seed being the one exception.
Similar to Amazon, none of the 10 top-selling Black Friday brands on Walmart.com were also among the most sponsored in either Grocery or Pet. In Beauty, however, three of the best-selling brands — L’Oréal and its CeraVe subsidiary, along with Revlon — gained a stronger ROI from their ad spend (anecdotally speaking, of course).
But there was an even stronger correlation between the most-sponsored and top trending items at Walmart.com:
- Six of the top-sponsored Beauty products also made the trending list.
- Five Grocery items did the same, along with three similar items from the most-sponsored brands.
- Nine of 10 items in Pet were the same on both lists, with the last product also a similar SKU.
Across all of these trends, one thing seems clear: Black Friday is still a critical sales window for consumer product marketers, even if their brands aren’t typically associated with this key holiday event. There simply is too much traffic visiting Amazon.com and Walmart.com for brands to be sitting on the sidelines — or on page 2 of search results — and letting this level of exposure pass them by.
For more insights, join experts from Analytic Index and The Mars Agency for a holistic review of the Cyber 5 holiday window at Amazon and Walmart with a special webinar.